Fifteen years ago, Rohit Saran clicked a link and could not believe what he was seeing. An eighteen-book mythology — the Mahabharata, with its impossible tangle of characters and feuds and inheritances — had been flattened into a single, navigable picture. Thousands of relationships. Hundreds of events. One screen.
"I had no idea," he told the room, "that an 18-book mythology could be — if I can use the term — data-fied and visualized the way you did." The man who had built it was the same man now sharing his screen: S Anand, who calls himself an LLM Psychologist at Straive, and who co-founded the data-science company Gramener back in 2011. The Mahabharata visualization still exists. So does the little tool Anand once built to help his family pick which movie to watch on a weekend — a personal problem turned into a public artifact, fourteen years before anyone said the words "generative AI."
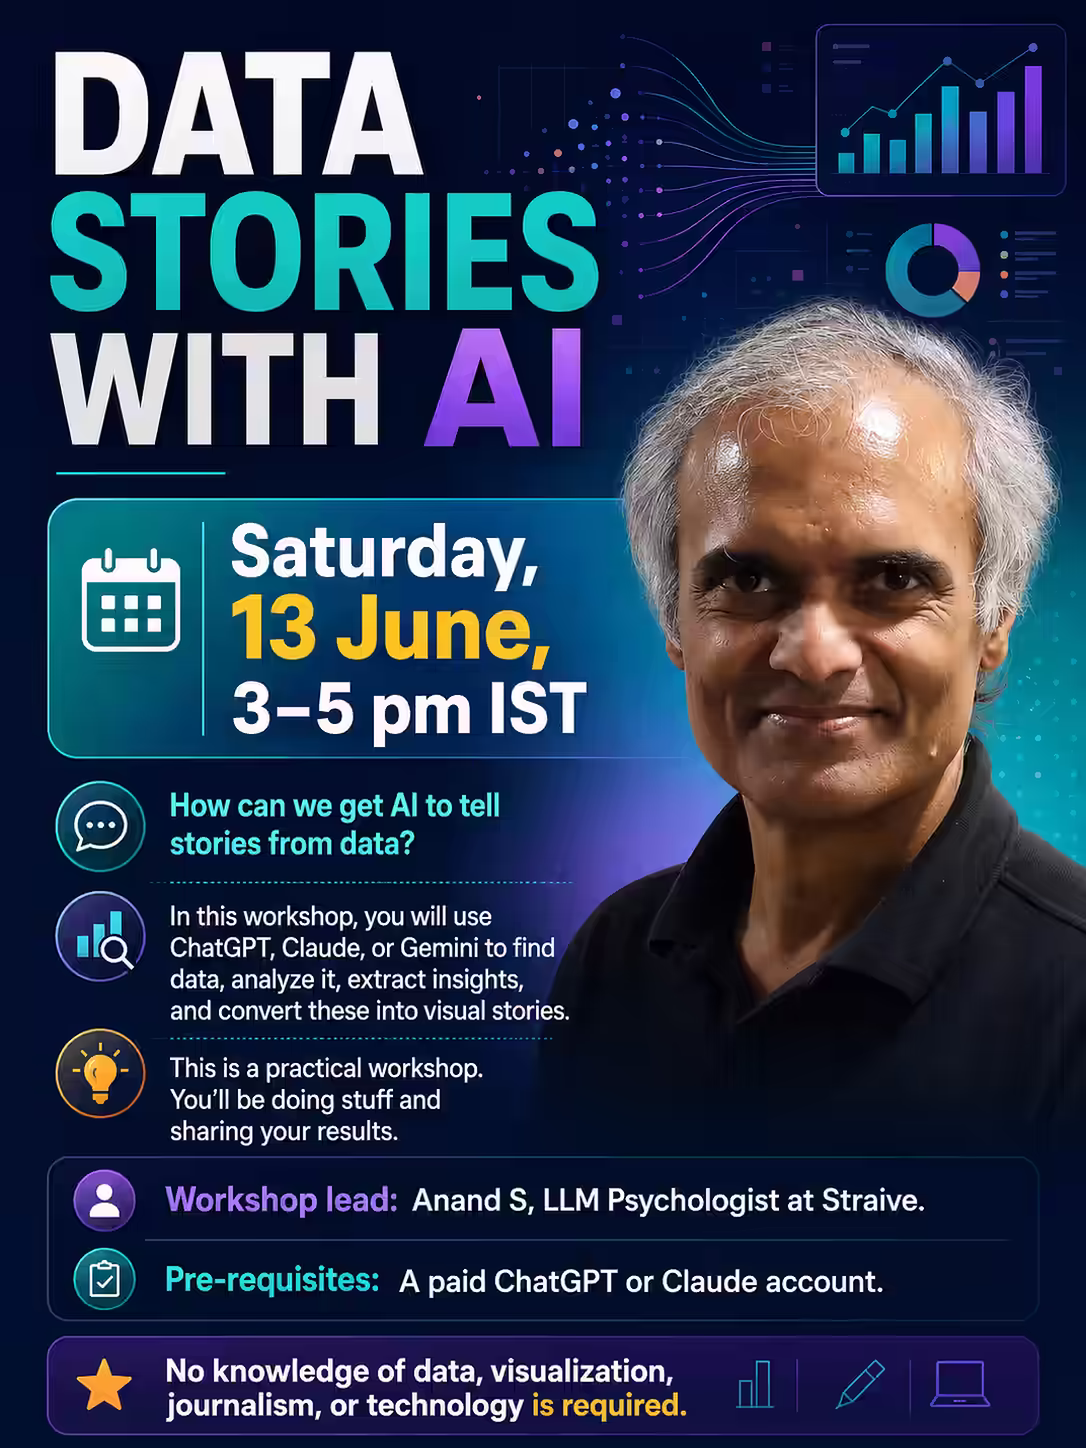
This is the texture of the man hosting today's workshop: someone who has been quietly turning data into stories since before most of his audience had heard the phrase "natural language processing." And the audience was large. By the time the session began, more than 300 people had registered — journalists, designers, editors, analysts, a few students, scattered across Mumbai, Chennai, Delhi, Hyderabad, Bengaluru, and one lone soul in London. It was organized by Rohit Saran, Managing Editor of The Times of India, who introduced Anand with a story that captures the whole afternoon better than any abstract could.
A few months ago, when I met Anand at a hotel reception, among the first things he told me — which totally threw me off — he said, "Rohit, let me hire four, five people for you. Tell me where your skill gap is." I was taken aback. I thought there was some secret deal. But then I realized he was actually talking about AI agents.
— Rohit Saran, Managing Editor, The Times of India
What those agents produced inside the Times of India newsroom became, in Rohit's words, "one of the rare examples of being AI-augmented and AI-automated both — and I would say even AI-customized." That last word is the one to hold onto. Anything can be automated; commodities are cheap. But customized work — work shaped to you — is where advantage lives.
AI agents have reached a stage where anybody can benefit. It will augment parts of work you wanted to but didn't have time for. It will automate the parts you didn't want to do. And — most importantly — it can customize it for you. You can develop a unique competitive advantage.
— Rohit Saran, setting up the workshop
Then Anand took the screen. And instead of presenting, he did something stranger. He turned 300 strangers into his research staff.
The room becomes the dataset
"Each of the agents are in your pockets as much as on my laptop," Anand said, and shared a link in the chat: a live form at forms.s-anand.net/aistories. It was not a polished questionnaire. It was a workbench. He would keep adding questions to it during the session — about who they were, what they believed, what they wanted to explore — and feed the answers straight back into ChatGPT in real time.
"What we have," he said, "is an opportunity for several dozen of us to create data stories on the fly using agents, possibly publish them — who knows what we find. Let's do that." Thirty-nine people answered. The portrait that emerged was its own small data story. Six journalists. A cluster of designers and developers. A surprising contingent — nearly a third of the wishes — from finance and economics: company financials, oil imports, share-price anomalies, BBMP tax spending. (Most journalism workshops assume the appetite is for politics and sport. This one revealed a latent hunger for market and consumer data.)
Then came the question that would quietly frame the whole afternoon. Anand asked the room how confident they felt about getting AI to find a real insight in data. The average answer was about 62%. Lean-positive, but hedged. He answered his own question without hesitation:
I have absolutely no doubt that today it's going to blow my mind, because it does that every time. The problem is not that it blows my mind. The problem is that I'm not able to absorb the stuff. If insights become so cheap, then what do we do? How do we distribute? How do we prioritize? The problems start becoming very different — and I don't even know how to frame what the new problems are. But, good problem to have.
— Anand
That inversion — from "can AI find insight?" to "what do we do when insight is infinite?" — is the intellectual spine of the session. Everything that follows is really an attempt to answer it.
"Why should I do that? It should do it."
Anand began not with data, but with content. The Times of India runs a print property called Hack of the Day — small, templated cards offering one crisp, useful tech-life hack. Secure your Gmail with a recovery number. File an RTI online. Boost slow Wi-Fi. They are not creative posters; they are, as ChatGPT itself would later observe, "a content system masquerading as a design." And like all such series, they have a problem: after the first hundred, the well runs dry.
Here is where Anand demonstrated the single move that, he said, has been the most effective philosophy of his last few months. He did not sit down and write a careful brief specifying that each hack needs a title, a "what it solves," a "what to do," and a caution. Instead, he handed ChatGPT the example cards and asked it to write his instructions for him.
If I had to ask an intern or an AI agent to create a bunch of these, what prompt should I give? I'm not asking it for another hack. I'm doing what's now called meta-prompting. Why? Pure laziness. You tell me what I should be asking you to do, so that I can ask you to do it, and then you do it. Basically — delegate all of the work.
— Anand, on meta-prompting
The AI, it turned out, reverse-engineered the format with unnerving precision: a fixed content schema, fixed editorial rules, a fixed layout contract. "These ten images are highly templated," it wrote back. "They are not creative posters. If you want an intern or AI agent to reliably produce more, do not ask for 'something similar.' Ask for a fixed schema." From there the work became almost embarrassingly small: research more hacks, draft them in the same JSON structure, fact-check, repeat. One tweak from the editors — make it more technology-oriented — and the pipeline was live.
This is what it takes to automate an entire property: asking ChatGPT to do this. Effort is really one minute of my attention and about 20 minutes of its effort — which I don't care about, because I can always go on to another tab.
— Anand
And underneath the laziness was a real method — a way of working that Anand described as the most reliable trick he knows:
Watch closely where you feel stuck, write it down — "here's where I'm stuck today" — and copy-paste that into the AI. Either you get unstuck, or you get stuck on something new, which you write down again. The results have been one or the other. I have not stayed stuck. The bottleneck has constantly shifted. That may be the defining characteristic of what AI is for.
— Anand
The AI-generated version of the property now lives on its own Hack of the Day page. Here is one card it produced — content and visual design, both machine-generated:
"But is it data?" Anand asked. "Maybe, maybe not. Borderline. Let's assume it is not quite data — it's research stories." Which raised the next question, and the only one that really matters before you trust a machine with numbers.
Can the machine actually count?
Anand added a sixth question to the live form: How confident are you that AI will give correct answers to the numerical questions that data analysis involves? The room's answers clustered around 70% — calibrated, slightly skeptical, and, as it turned out, right to be. Because the reasoning behind the question is the hinge of the entire craft:
If AI is going to mess up on arithmetic, then at least that part of the work you should not delegate to AI. A big part of knowing how to use AI is knowing where it does a good job and where it does a bad job — so we take the good and drop the bad.
— Anand
So how bad is it, exactly? About a year earlier, Anand had run a clean experiment: he asked 50 models to multiply two numbers — two digits, then three, all the way to nine. The results were humbling. Gemini 1.5 Pro, a strong model from March 2024, couldn't even reliably do three-digit multiplication: it got it right one time in five. The best models of that era — Claude 3.5 Sonnet and Opus — topped out around five digits. The newer "thinking" models reached seven. None could reliably do nine.
"Now, we have not one nine-digit multiplication," Anand pointed out, "but in data analysis we'll probably do a thousand. So there's a good chance it will go wrong." And here was the twist — the move that, he said, "may be the single biggest enabler for our session." You don't ask the language model to do the math at all.
That's like asking a person, "Can you multiply two nine-digit numbers in your head?" People think in language; computers think in mathematics. What would you do if you hired an accountant? You'd give them a calculator. The magic words are simply: "Write and run a program to do X."
— Anand
To prove it, he talked — out loud, rambling slightly, on purpose — to ChatGPT, asking for a simple, mind-blowing program a grade-eight student could understand. It wrote one: a tiny "arithmetic assistant" that picks the best breakfast under a ₹200 budget and a 500-calorie limit, checking every possible combination of eight foods.
Best basket under ₹200 and 500 calories:
Idli ₹30 protein 4g 120 cal
Curd cup ₹40 protein 8g 90 cal
Eggs ₹60 protein 13g 140 cal
Milk ₹35 protein 7g 150 cal
TOTAL ₹165 protein 32g 500 cal
"Eight foods created 255 baskets. With 20 foods, this same idea checks over a million — and still gives the exact best answer. This is arithmetic as a tool, not arithmetic as memory."
Two things, Anand noted, were quietly important about how he'd done it. First, he had spoken rather than typed — because in a workshop you're talking to the audience as much as to the machine, and because, as he put it, talking helps you think. Second, he had rambled on purpose:
If I knew exactly what I wanted, I'd give a crisper brief. But talking helps me think. If I have an assistant who is infinitely patient, I may as well use that patience to sharpen my own thinking. When you craft data stories with AI, you don't need to know what story you want to craft. The story can evolve along the conversation.
— Anand
And then a line that doubled as a job description for everything an LLM can be:
What you have in your pocket is not just an expert language model. It is an expert journalist, an expert programmer, an expert financial analyst, an expert bureaucrat — an expert anything that the world's knowledge can encompass. There are things it is not. It is not an expert parent. And what it is not is really the bulk of what I'm trying to figure out.
— Anand
One more habit, sharp enough to bookmark: when the model finished, it tried to explain itself at length. Anand cut it off. "Explain in two or three sentences. I have ten seconds." His rule:
Do not give your assistant the respect, the time, the space to explain in great detail what they did. Cut them off. Tell it to me in terms I can understand.
— Anand
He set his own confidence on the arithmetic question at 90%. Why not 100%? "Sometimes I'm not sure I'm asking the question right. Sometimes I'm not sure it understood my question correctly — even when it doesn't make a calculation mistake." Hold that distinction. It returns, with force, an hour later.
Crowdsourcing the audience as agents
Now Anand needed data. But he refused to go looking for it himself. He added a seventh question to the form — What's a dataset or story you'd like to explore? — and watched the answers pour in. India's shrinking population. Oil imports from Russia and Saudi Arabia. IPL auction prices versus actual performance. Actors-turned-politicians. Women in the labour market. Gender and forests in the Himalayas. Air pollution versus life expectancy.
Then he did two things at once. He treated the audience as agents — "I'm crowdsourcing the task of what is interesting for this audience" — and he noted, almost as an aside, that he didn't even strictly need them:
I can also ask ChatGPT to research each one of you, act as if it were that person, and answer the question — what might they have said? It turns out to be about 80% accurate. There are many famous people here. It will impersonate them mentally and answer. That's another form of crowdsourcing as far as I'm concerned.
— Anand
He pasted the real answers into both ChatGPT and Claude , wrapped in angle brackets so the model knew where the answers began, and attached what he called the Ideation Protocol — a brainstorming recipe distilled from experience:
When I want it to brainstorm, I ask it to diverge, then converge. Diverge by coming up with a whole bunch of ideas. Find people who'll see this differently. Find domains that see it differently. Then throw out the obvious stuff — I don't want standard stuff — and converge on which ones are likely to work, likely to be interesting.
— Anand, on the Ideation Protocol
What came back was a genuine education in how two frontier models think differently. ChatGPT produced punchy, headline-ready franchises: "Oil → Wheel → Wallet" (tracing imports to auto sales to consumer spending — because "vehicle registrations are a better middle-class stress sensor than GDP"); "India starts shrinking before India shrinks" (fertility collapse, state by state); "Years of life lost, degrees gained." It even pushed back on a methodological trap, warning: don't infer caste from candidates' names — use reserved constituencies and party strategy as defensible proxies. Claude reached for structural metaphors — seismology, ecology — describing fertility decline as a "slow earthquake" where "some cities rupture decades before others, with hard political consequences when delimitation eventually reweights seats."
There are two kinds of data-discovery problems. One: I have a dataset in mind and want stories from it. The other: I want to write something, somewhere in some area — what can I write about? That second problem — discovery — this is wonderful for. And note: there's no cost or danger in running it. If it's good, bonus. If it's wrong, we lose nothing. Why bother taking a risk? Start with what's easy, find out what works, then scale.
— Anand
The ₹299 dataset that was too small
The models kept gravitating toward India's vehicle-registration Vahan data. Anand found a copy on Dataful for ₹299, paid by UPI on the spot — "I can just put in a UPI and do that" — downloaded the zip, and asked his assistant to open it rather than looking himself. The verdict: 13 kilobytes. "That is too small. That is not worth analyzing. 13 kilobytes I can do in Excel." A small, funny, honest dead end — and exactly the kind of low-cost failure he'd just argued you should welcome.
So he went hunting for something messier and bigger, and landed on India's air-quality data — the NCAP AQI dataset for Indian cities, 2015–2023. It was a page full of CSV files, none too clean. Which posed a small logistical puzzle, and produced the afternoon's best piece of audience participation. How do you download a whole page of CSVs at once?
Tanay Sukumar — formerly head of Mint's data team, days away from joining the Economic Times — unmuted. (Anand, deadpan: "No, no, you are banned.") His answer:
Claude has a browser connector, so I'd pass it the URL and say "download the CSV files from this page."
— Tanay Sukumar
Anand fired up the Claude browser extension, pointed it at the page with Sonnet — "a medium-quality model" — and watched it take a screenshot, read the page, write some JavaScript, and quietly assemble a single 12 MB zip of every file. A red arrow flickered across his screen: the plugin taking the wheel. The whole thing felt, he said, "literally like telling an assistant, 'Get this done' — and the assistant has more human-like tricks up their sleeve."
When Rohit asked how to verify the download was complete, Anand's answer became a small masterclass in prompting:
"Open another session — an independent agent. Upload the dataset and tell it: 'Check what is missing.' That phrasing is important. If you ask 'Is it matching?' it might find 99% matching and get lazy. 'Check what is missing' is an invocation to find the error — and that makes all the difference."
Why it works: another chat is almost like another person. You get independence — easy cross-checking, easy division of labour — at the cost of memory.
He dropped the consolidated AQI dataset zip in the chat for everyone to download, and issued the instruction that turned a lecture into a laboratory: "Use your coding agent of choice. We're going to create data stories — and by 'we,' I mean all of us."
"Blow my mind with fantastic insights"
Anand ran two prompts in parallel, and the gap between them is a lesson in itself. The first was deliberately, almost comically lazy:
My prompt to the first assistant — and I'm feeling very lazy right now — is: "Blow my mind with fantastic insights that nobody would have known about." That's it. Let this guy run.
— Anand
The second was structured — the kind of thing he builds for any serious analysis, anchored to a reusable Data Analysis Template he keeps on hand. He told the model to think like a psychologist and a journalist; to infer, from the audience's stated interests, what insights would land; to sort those into answerable and unanswerable; and to run only the highest-impact, highest-ease ones.
Think like a psychologist, a journalist, an expert who can infer human preferences from evidence. Apply that to these answers and infer what would be powerful for this audience. Then find which of those you can actually answer from this data — and which you can't. Pick the ones with the highest impact and ease. Run those.
— Anand's second, structured prompt
Both prompts converged on the same uncomfortable truth. And it was a genuine surprise — to Anand most of all.
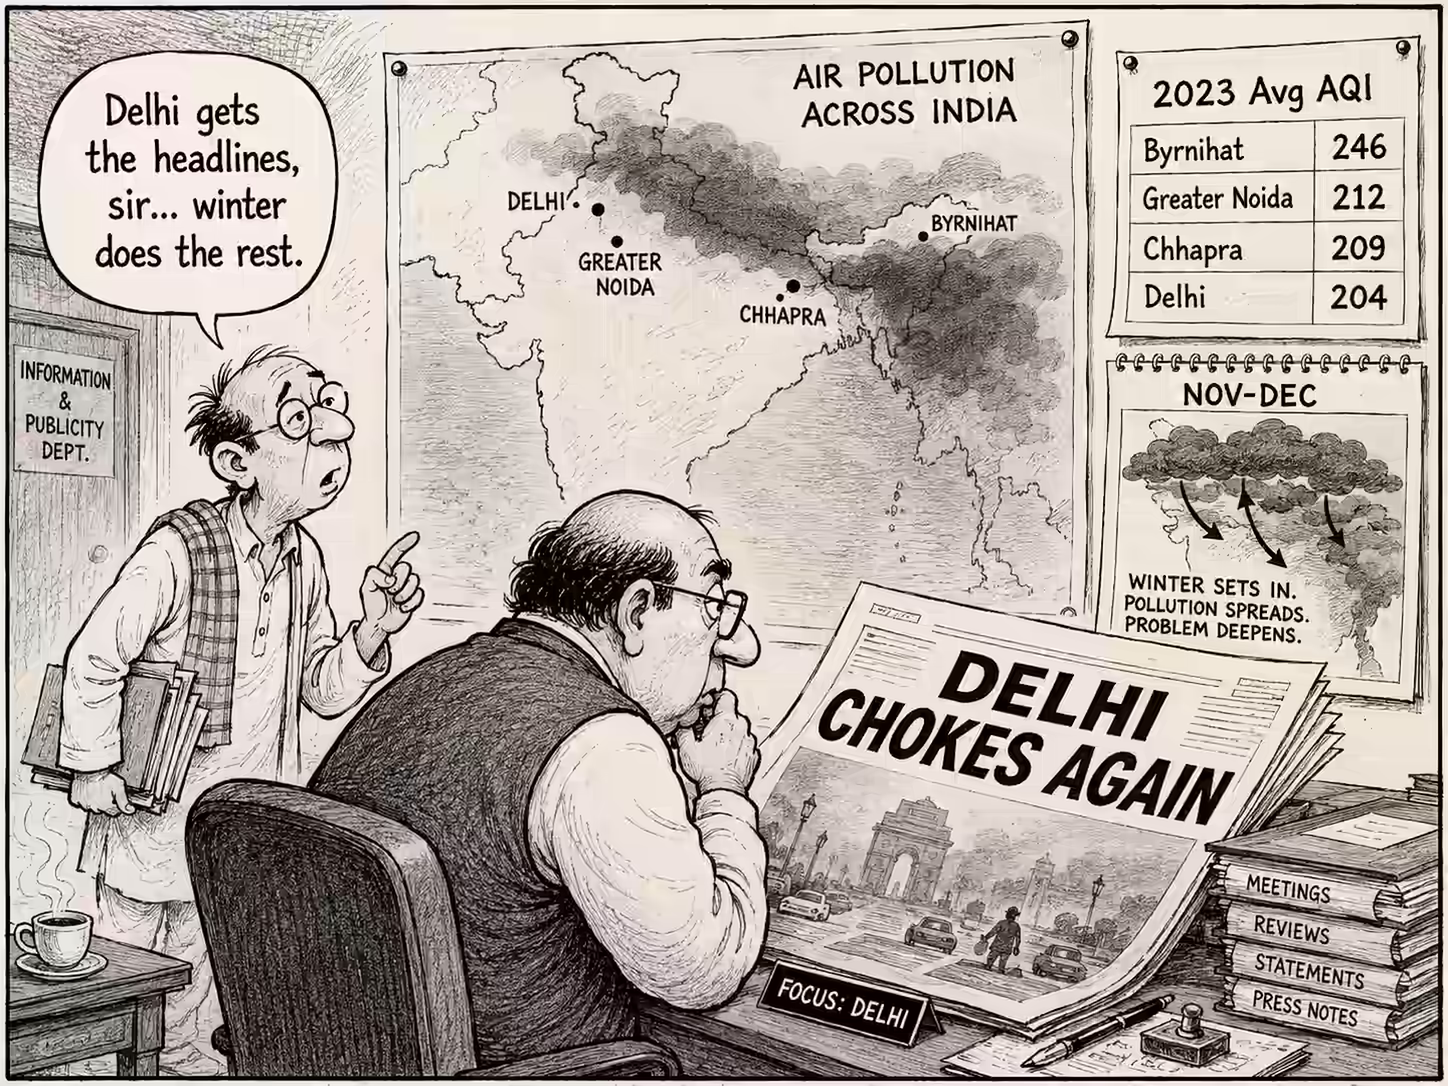
Delhi is not the villain. It is the poster child. Ghaziabad was worse than Delhi 63% of the time. Greater Noida was worse more than half the time. So was Bhiwadi.
— ChatGPT, analysing the AQI data
"India has a calendar," the model went on. November is not "a bit worse" than August — it is a different regime (average AQI leaping from roughly 70 to 199). The dominant pollutant itself rotates with the seasons. And then the line that stopped Anand cold, because he lives in Chennai:
Diwali is visible in the data — but not always where you expect. Chennai's AQI rose by an average of +61 points across nine Diwali years, despite being far cleaner than the north overall.
— ChatGPT
I thought the opposite — that Chennai's rise would be less than other cities. This is not only a surprise; it's a useful surprise. I can use it as a fact to tell people: tone it down during Diwali. So it's an actionable insight as well.
— Anand, getting blindsided by his own city
The structured prompt sharpened all of this into a single editorial thesis — the sentence the whole dataset had been waiting for someone to write:
Don't ask "which city is polluted?" Ask "which city becomes unlivable, in which season, and why?" Across North India, the air can get more than 200 AQI points worse in winter than in monsoon. Delhi's AQI becomes a different city in November and December — every single recorded day in those months was Poor, Very Poor, or Severe.
— ChatGPT's audience-aware analysis
The audience was already off and running. Narendra Ghate unmuted to share a full AQI dashboard he'd built from a single prompt — 267 cities, daily records, monthly averages, seasonal patterns, worst and cleanest cities. "Just a single prompt has given a very substantial visualization," he marvelled. Anand's tip for getting output you can actually share: "Visualize this as a single-page HTML file." Here is the very page ChatGPT generated for him during the session:
And here the workshop's most quietly profound idea surfaced — from the audience. Neha had fed the same data to Claude, and pushed back: "Claude's first point was that Ghaziabad, not Delhi, was India's real pollution capital for years. But I can't see Ghaziabad in this chart." Anand's answer was a small revelation about what "the story" even means:
I told it to deliver a different story. It already knew Ghaziabad was worse than Delhi 63% of the time. But the story I asked for was the monsoon-vs-winter gap — and in Ghaziabad that gap isn't as stark. Still, that's a useful comment: since Ghaziabad has such high pollution, let's include it as a point of reference. And that's all it takes.
— Anand
He added it. The second version of the chart — with Ghaziabad restored for context — is below. The point is not the chart. The point is that a reader's one-line objection became, in seconds, a revision.
"The more errors you find, the better"
Insight is cheap. Trust is not. Ashwin Ahmad, who covers energy and India's oil imports, raised the question every journalist in the room was waiting for. He'd asked for a bar chart comparing India's oil imports from Russia, Saudi Arabia, and the US since 2016. ChatGPT gave him the chart — but when he asked for sources, it handed him a vague list of Reuters and BBC reports. "One can't totally rely on that," he said. "Is there any tool by which I can check that ChatGPT is giving me the right data?"
ChatGPT is excellent for statements — foreign ministers, delegates, especially Chinese. Where I find a problem is with data. It gives me data but does not show me the source.
— Ashwin Ahmad, on the journalist's recurring nightmare
The fix Anand dictated — live, into ChatGPT, then pasted to the chat — is worth committing to memory. It inverts the usual instinct of asking a model to confirm its work. Instead, it sets the model loose to attack its own output:
You've given me a bunch of statements. I want you to find every single error in each of them and list them. For any claim where you can't identify an error, cite verbatim from the source and include a link, so I can cross-verify. The more errors you find, the better you have achieved your objective. Make sure even trivial errors are identified.
— Anand's verification prompt
Then, instead of reading the long list of errors it returned, two more words: "Fix and redo." But the diagnosis ran deeper than any prompt. Ashwin's conversation, Anand could tell just from glancing at the shared screen, was the real problem — a single thread that had been asked to do a dozen unrelated things.
This is roughly the equivalent of telling somebody, "Buy me a car, and fill in my bank statement while you're at it. Also plow my fields. Also sort out my kid's school plan." And by the way — it's going to diligently get confused. New conversation, new topic, new chat.
— Anand
Does upgrading help, Ashwin asked, or do I have to fix my prompt? "Both," said Anand — the better model (ChatGPT Plus at ₹2,000 over the ₹400 "Go" tier over the free version) reduces errors independently of the prompt. The deeper instinct, though — start fresh, stay on one topic — is free.
Pictures, comics, and a calendar of unlivability
With an insight in hand, Anand turned to representation — and made a careful vocabulary distinction. He asked for the visualization not as a "slide" (the model might reach for PowerPoint, or an image) but as a "single-page HTML slide," because HTML is a language the model understands deeply and can draw real charts in. Then he opened a second branch and asked for something else entirely:
Draw a really nice R.K. Laxman-style comic panel that communicates the main story.
— Anand, branching the conversation
What he was really demonstrating is that images have quietly become a serious medium for analysis, not just decoration. "We normally don't think of using images for many things," he said. "For charts we say it has to be exact; for text we want it editable. But entire slides can be created as images — South China Morning Post-style infographics, sketchnotes, comic panels. Many of my talks, I compress into single-page infographics." Here is the comic strip ChatGPT drew for the air-quality story:
To see the range of formats an LLM can render — exploded diagrams, alluvial flows, cutaway cross-sections, comic panels — Anand keeps a gallery he built by asking the model itself to list "the different ways I can explain Rock-Paper-Scissors." It is a strangely delightful reference:
The calendar of unlivability
Then Narendra returned with something the whole room leaned into. He had asked his agent to go beyond air quality — to fold in temperature and find which cities become most unlivable, and when. The result was a colored grid: cities down the rows, months across the columns, each cell shaded by an "unlivability" index. Delhi glowed maroon in summer and November; Ahmedabad too; Bangalore stayed mild throughout. "Where the air and heat both turn against you," the title read.
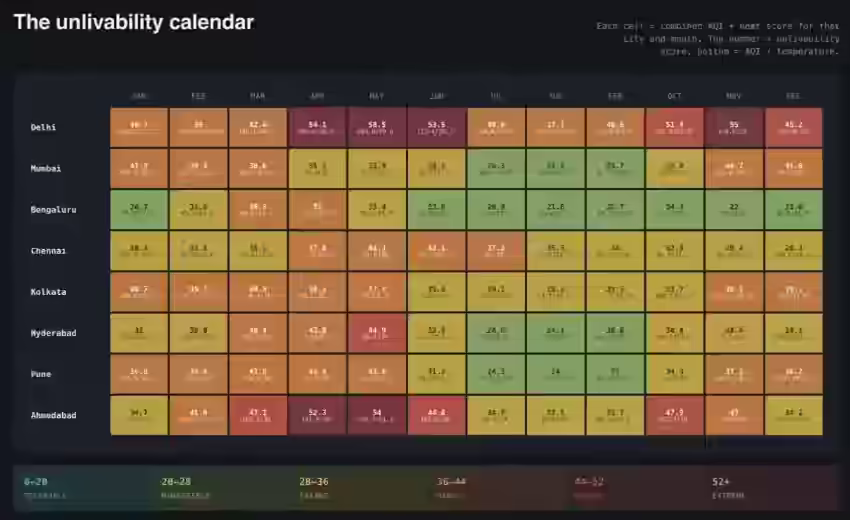
What happened next is the actual point of the workshop. The chart became a magnet for human insight. Ram noticed the weighting hid something real: in Delhi's summer, pollution is lower than winter, but heat peaks — so an equally-weighted index implies "no respite" year-round, which isn't quite true. And then he spotted the anomaly:
One thing I find interesting — November is an outlier for Delhi. Summer months, understandable. But why is November an outlier? That is very, very intriguing.
— Ram
The room answered as only a room of journalists could. November is when Diwali usually falls — and in Delhi, unlike Chennai's single spike, it's a longer span. It's also when Punjab, Haryana, and western UP farm fires peak. And, Tanay added, when wind speeds drop. "A deadly cocktail," Anand said. The data had a hole; the humans filled it; and then came the move that ties the whole craft together:
Ram's question is itself a point of insight. Have AI build it, show it to people, take their feedback, and literally dump it back: "Here are the questions I was asked. Research them. Incorporate their improvements. Fix their confusions." Because generation is cheap and verification is cheap, the effort shifts entirely to feedback — and feedback can now be crowdsourced.
— Anand
You can even crowdsource the crowd, he noted: ask another autonomous AI to "pretend you are the audience — what questions pop into your mind?" Combine its questions with the humans', feed both back, and a single story grows into a richer one, "perhaps even a series."
Two participants pushed on this, and their worries were the most thoughtful moments of the afternoon. Neha asked about loops — the way long conversations start producing repetitive, recycled stories no matter how many "be novel" guardrails you add. Anand's answer was practical and bracing:
The most important fix — maybe what you're already doing — is: give up and move on. The cost is low. Beyond that: new chat, always. New topic is always a new chat. Then a new model — a smarter one, or a different provider entirely. The underlying models don't have memory; they replay the entire conversation once. If they're re-listening to two hours of discussion and then you say "do X," they're confused.
— Anand, on escaping the loop
And to improve the prompt itself? Meta-prompting again: "Copy the entire history, give it to a model, and say: this is utterly repetitive — what should I do to make it novel? You give me the prompt. You use AI to teach you AI."
Narendra's worry was deeper, almost philosophical. If I keep recursively asking for a better answer, he said, I'll get the perfect output by the fourth prompt — but I won't have internalized anything. The people who spotted the November anomaly learned something in a single glance. Am I trading away understanding for polish? Anand's reply reframed the entire anxiety:
How do you judge something that may know more than you do? Isn't that what every editor does? Every judge, every auditor, every teacher, every coach? We constantly guide intelligences more capable than us in specific ways. Our ability to steer and verify is not constrained by our ability to reproduce what they do.
— Anand
His suggested prompt for the curious: "How do professions guide or steer smarter intelligences than themselves, when they don't have enough information?"
When the data is a picture from space
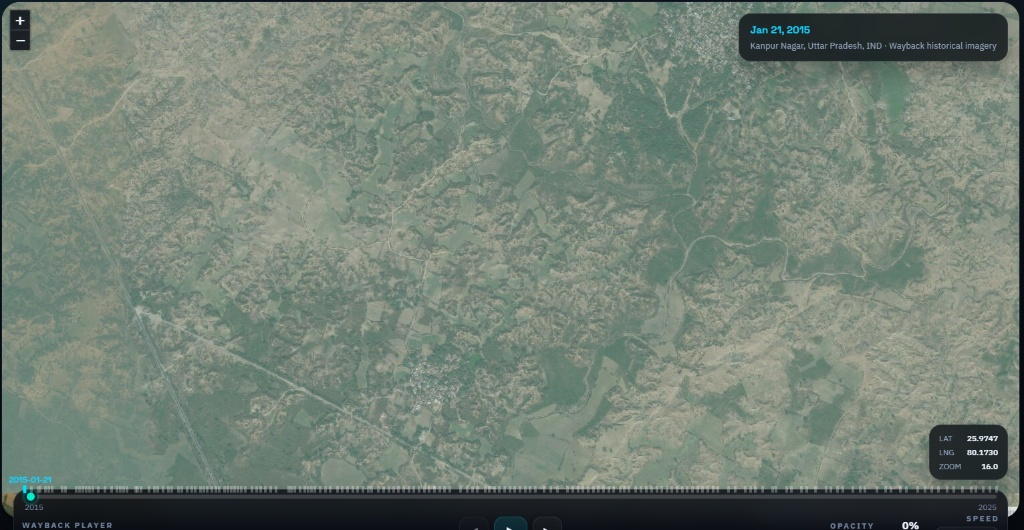
Everything so far had been numbers — structured rows and columns. For the final stretch, Anand handed the screen to Varun, a Straive colleague who is, pointedly, not a journalist, to show a completely different kind of data: satellite imagery. Varun had used a model called OlmoEarth to compare India's landscapes across a decade — not by labelling what's there, but by measuring how each tiny grid changed from 2015 to 2025.
Varun took 100-metre grids and, for each one, asked — like asking ChatGPT, but in a slightly different way — "What is the similarity of this patch to the word 'vegetation'? To 'water'? To 'urban'?" Red means low similarity to vegetation; green means high.
— Anand, narrating the map
Over Kanpur, the river snaked through in vivid green; industrial zones burned red. But the real lesson was about false positives — and it rhymed beautifully with the Ghaziabad moment from an hour earlier. Varun zoomed into a patch flagged as a dramatic loss of vegetation. In 2015, it was green. In 2025, gone. A scandal? No:
That was algae. The lake has been cleaned — the algae's gone, and so the "vegetation" dropped. A lake cleanup is not what we think of when we think "less vegetation." When you blindly use a vegetation index, it reports these false positives.
— Anand
This is exactly the trap, and the gift, of automated analysis. The Bellandur and Adyar stories below show it twice over: an algorithm screams "water vanishing!" and a human, with one round of research, discovers a restoration project — a better story than the alarm would have been.
Kanpur · a new lake appears

Not a flood — the cooling reservoir for the ₹21,780-crore Ghatampur thermal plant. "National mega-infrastructure permanently redraws the local ecological map."
Bengaluru · Bellandur's missing water


"Less water does not always mean bad." A model flags a deficit; a journalist's research turns it into a story about rejuvenation — or, at Bellandur, about 260 million litres of daily sewage. Either way, a real story.
Varun's prompt to Gemini — chosen for its visual skills and built-in maps tool — did something genuinely new. It fetched the location's coordinates, searched the internet for what actually happened there, verified it across multiple sources, and only then wrote a four-to-five-line article in the style of "a TOI reporter." Crucially, Anand had given it the power to say no:
I've given it the power to reject my request — if the location doesn't have a newsworthy story, if it's a false positive or a normal seasonal change. "You are allowed to reject my request if it does not have any story."
— Varun
Three things, Anand summed up, made this remarkable: you can build stories out of visual data; the model can fact-check and ground them against real sources; and a non-journalist, with two or three iterations of feedback, had produced publishable copy. The full collection — flooded farmlands, vanishing wetlands, mangroves erased for sewage plants, an entire change-desk of India — lives here:
The economics, and the question of trust
As the session wound down, the questions turned practical. Narendra asked how the Chinese models — Qwen, DeepSeek — measure up. Anand pulled up his own LLM pricing scrollytelling, which plots quality against cost over time, and gave a rule of thumb:
Chinese models are good if you're cost-conscious — highly cost-conscious, at scale. DeepSeek is pretty good, better than a PhD candidate. But the frontier models are a little ahead — a rough rule of thumb is about six months. Even if all advancement stopped, we'd have a fine range of intelligence-cost trade-offs. Unfortunately or fortunately, it's not stopping. It's accelerating.
— Anand
On whether to pay at all, Anand was unequivocal — "this is the highest-ROI investment one can purchase" — and offered a psychological hack worthy of a behavioural economist:
Start with the Plus version — ₹2,000 — for one month, on Claude or ChatGPT. Use it as much as you possibly can. You're paying ₹2,000; you may as well make the best use of it. It serves two purposes: you utilize your subscription, and you learn to use more AI. At the end of the month, if it's paisa vasool, continue. If not, unsubscribe — and re-evaluate in six months, never longer, because of the speed at which things change.
— Anand
The last big question, from Neha, was the one this entire report has been circling: at what stage does the human check the work? Anand's answer was the most human thing he said all day.
I'd treat it the same way I'd treat a fresh journalist who's joined my organization. At first, I check very carefully — should I even retain this person? Over time, confidence builds. Then I check what's important and stop checking what isn't. If it's a medical report, I triple-check. If it's "what should I eat next," who cares? Stratify. Build confidence. Delegate the verification. Periodically go back and make sure nothing has regressed. Long way of saying: work with it just like you would work with a person.
— Anand
What the room changed its mind about
Anand ended where he began — with the form. The final two questions asked each participant what they'd changed their mind about, and what they'd try on Monday. The answers, taken together, are the truest measure of the afternoon.
The shifts were rarely technical. They were about permission. Sabi captured the whole workshop in three sentences: "I thought we should not use AI for prompt-writing, downloading, making charts — because then I wouldn't learn how to do all that. But now, my mind has changed." Manju, who had been "wary of giving large amounts of data to AI," now would. Narendra hadn't realized datasets were so easily available, or that you could link a visual story to one. Jude landed on the meta-lesson: "the quality of insights depends not just on the data, but on how effectively I frame my questions."
And the Monday promises were concrete and modest — exactly as Anand hoped. A live news event as a dataset. Air traffic across the top ten cities, then maybe a hundred airports. Share-price anomalies amid the war. Football dark horses. Single-page HTMLs adapted for print. Ram, charmingly, just wanted to play with the art-style gallery.
A handful of participants shared the actual conversations and visualizations they built during the two hours — small proof that the room didn't just watch, it made things: Ravi's chat, Harish's chat, Gopal's Claude analysis, Rohit Chowdhury's Gemini run, and Manju's visualization. (One sharp observation, from Udaibir: Claude had quietly benchmarked against 57 cities that stayed constant across all years, rather than the full set that grew over time — a methodological nicety nobody had asked for.)
There was, Anand might note, one thing almost nobody wrote down. Across all the mind-changes and Monday plans, scarcely anyone mentioned verification — the very discipline that the Ashwin and Ghaziabad moments had been built to teach. The room learned, vividly, to create. Learning to check before you publish is the contract for the next workshop. Which is, perhaps, the most honest insight the data produced all day.
Data stories with AI is not about AI just helping us write data stories. It is about us helping AI write the data stories. Let it do the work; we do less.
— Anand